
Employee Monitoring on Linux: Deployment Guide for Ubuntu, Debian, and Developer Environments
Employee monitoring on Linux is a native agent deployment that tracks application usage, browser activity, idle time, file operations, and periodic screenshots on Ubuntu, Debian, and CentOS/RHEL workstations. This guide covers distribution compatibility, installation methods, enterprise automation through Ansible and Puppet, what the Linux agent captures, and the specific considerations for deploying monitoring on developer and engineering teams.
Why Is Linux Monitoring Increasingly Relevant for Commercial Teams?
Employee monitoring on Linux describes the deployment of workforce activity tracking software on Linux-based workstations and endpoints, covering application usage, browser activity, idle time, and visual documentation through periodic screenshots. Linux monitoring was historically a niche requirement, but the distribution of Linux endpoints in commercial environments has expanded materially as specific roles and industries standardize on Linux-based workstations.
DevOps and SRE teams running Ubuntu or Debian workstations are the fastest-growing Linux monitoring segment. Data science and machine learning teams frequently use Ubuntu because of better GPU driver support and native compatibility with Python ML toolchains. Software development teams at companies that standardize on Linux for consistency with their server environments represent a significant and stable segment. In emerging markets, call centers and BPO operations use Linux-based open-source stacks because commercial Windows licensing costs are prohibitive at scale.
How Large Is the Linux Commercial Endpoint Market?
Linux desktop market share in commercial environments reached approximately 4.5% of all business workstations globally in 2024 (StatCounter enterprise data), with significantly higher concentration in technology companies. In software development specifically, the Stack Overflow Developer Survey 2024 found that 47% of developers use Linux as their primary development environment (including macOS, which runs a Unix-based kernel). For technology organizations managing fleets of Linux developer machines, monitoring deployment on Linux is not optional but a baseline requirement for complete workforce visibility.
Which Linux Distributions Does eMonitor Support?
eMonitor's Linux agent supports the most common commercial Linux distributions across both Debian-based and Red Hat-based families. The compatibility matrix covers the distributions most likely to be found in developer, DevOps, and data science environments.
Ubuntu LTS Releases (Primary Supported Platform)
Ubuntu Long-Term Support releases are the primary supported platform for eMonitor's Linux agent. Ubuntu 20.04 LTS (Focal Fossa), 22.04 LTS (Jammy Jellyfish), and 24.04 LTS (Noble Numbat) are all fully supported. Ubuntu LTS releases receive 5 years of security updates from Canonical, making them the stable foundation for long-term enterprise deployments. The 24.04 LTS release is the recommended target for new deployments; 20.04 LTS reaches end of standard support in April 2025 but remains on the compatibility list for organizations that have not yet migrated.
Debian
Debian 11 (Bullseye) and Debian 12 (Bookworm) are supported. Debian is commonly found in organizations that prefer a community-supported distribution without commercial backing. Many server and workstation environments that prioritize stability over cutting-edge packages run Debian. The eMonitor agent on Debian uses the same apt-based installation path as Ubuntu, with minor repository configuration differences.
CentOS and Red Hat Enterprise Linux
CentOS/RHEL 8 and 9 are supported through the RPM package manager. CentOS Linux's transition to CentOS Stream (a rolling release ahead of RHEL) in 2021 means that many organizations previously running CentOS 7 have migrated to either RHEL, Rocky Linux, or AlmaLinux. The eMonitor RPM package is compatible with Rocky Linux 8 and 9 and AlmaLinux 8 and 9 as direct CentOS/RHEL binary-compatible alternatives. Contact eMonitor support to confirm compatibility before deploying to Rocky or AlmaLinux in production.
Team Productivity, This Week
Productive hours / day
Activity mix
▲ Deep-focus time up 19% after protecting daily focus blocks.
Illustrative eMonitor dashboard.
How Do You Install the eMonitor Linux Agent?
eMonitor provides three installation paths for Linux, matching the deployment practice level of the organization: package manager install for hands-on IT administrators, manual install for environments where package manager access is restricted, and enterprise automation for organizations managing Linux fleets through configuration management tools.
Method 1: Package Manager Installation (apt/rpm)
For Debian-based distributions (Ubuntu, Debian), the apt package manager is the primary installation path. The installation sequence is:
- Add the eMonitor apt repository to
/etc/apt/sources.list.d/emonitor.listusing the repository URL provided in the eMonitor admin panel. - Import the eMonitor GPG signing key to verify package authenticity:
curl -fsSL https://packages.employee-monitoring.net/gpg | sudo gpg --dearmor -o /etc/apt/trusted.gpg.d/emonitor.gpg - Update the package list:
sudo apt update - Install the agent:
sudo apt install emonitor-agent - Configure the agent with your company token:
sudo emonitor-agent configure --token YOUR_COMPANY_TOKEN - Start the agent service:
sudo systemctl enable --now emonitor-agent
For Red Hat-based distributions (CentOS, RHEL, Rocky, AlmaLinux), the rpm/dnf path follows the same sequence with a .repo file added to /etc/yum.repos.d/ and dnf install emonitor-agent as the install command.
Method 2: Manual Installation
For environments where adding external repositories to production machines is prohibited by security policy, eMonitor provides a manual installation path. Download the .deb or .rpm package directly from the eMonitor admin panel, transfer it to the target machine (via SCP, Ansible file copy, or internal artifact storage), and install it with sudo dpkg -i emonitor-agent_X.X.X_amd64.deb or sudo rpm -i emonitor-agent-X.X.X.x86_64.rpm. Dependencies are bundled in the package, so no internet access is required after the package is on the machine.
Method 3: Enterprise Automation (Ansible/Puppet/Chef)
For DevOps teams managing fleets of Linux machines through configuration management, eMonitor provides an official Ansible role and Puppet module. The Ansible role handles the full deployment lifecycle: adding the apt/rpm repository, installing the agent, configuring the company token from an Ansible Vault-encrypted variable, starting and enabling the systemd service, and verifying that the agent is reporting to the eMonitor API.
A typical Ansible task using the eMonitor role looks like:
- hosts: monitoring_targets
  roles:
    - role: emonitor.linux_agent
      vars:
        emonitor_company_token: "{{ vault_emonitor_token }}"
        emonitor_agent_version: "latest"
The Puppet module and Chef cookbook follow equivalent patterns. All three configuration management integrations are available through eMonitor's enterprise documentation portal.

What Does the eMonitor Linux Agent Actually Monitor?
The Linux agent captures the same core activity categories as the Windows and macOS agents, adapted for the Linux application ecosystem. The monitoring data profile on Linux reflects Linux workflows: more terminal and IDE usage, less consumer application noise, and more browser-based tool usage relative to native desktop applications.
Application Usage Tracking
The Linux agent tracks which applications are running and which is the active foreground application, along with time spent in each. In a Linux developer environment, this typically captures: VS Code or JetBrains IDEs (IntelliJ, PyCharm, GoLand, WebStorm), terminal emulators (GNOME Terminal, Kitty, Alacritty), browsers (Chrome, Firefox, Chromium), Slack or Teams for communication, and any other GUI applications used regularly. Time-in-terminal is tracked as a single "Terminal" category; the agent does not read or record the commands typed in the terminal. Time in VS Code is tracked by application window; the agent does not access file contents or code.
Website and Browser Activity
Browser URL tracking on Linux works through the same mechanism as on Windows and macOS: the agent monitors the active browser's URL bar and records URLs visited along with time spent. Chrome, Firefox, and Chromium are supported on Linux. Productivity classification applies: GitHub, GitLab, Jira, Confluence, documentation sites, Stack Overflow, and cloud console URLs (AWS, GCP, Azure) are classified as productive for developer roles. News, social media, and entertainment URLs are classified as non-productive. The classification rules are configurable per team or role.
Idle Time and Active Session Detection
The Linux agent detects idle time using X11 idle time APIs (for X11-based desktop environments) and Wayland idle protocol events (for Wayland compositors including GNOME on Ubuntu 22.04 and later). The idle threshold is configurable: the default is 5 minutes of no keyboard or mouse input. Idle time longer than the threshold is marked as away time rather than productive time, ensuring that hours when a developer is in a meeting, thinking away from the keyboard, or genuinely away from their desk are represented accurately in the activity report.
File Operations
The Linux agent monitors file system events using Linux's inotify API, which provides real-time notification of file creation, modification, deletion, and move operations in monitored directories. By default, the agent monitors the user's home directory and configured work directories. This data is useful for DLP (Data Loss Prevention) purposes: detecting when large numbers of files are copied to an external location or when sensitive files are moved to non-work directories. The agent records file paths and operation types, not file contents.
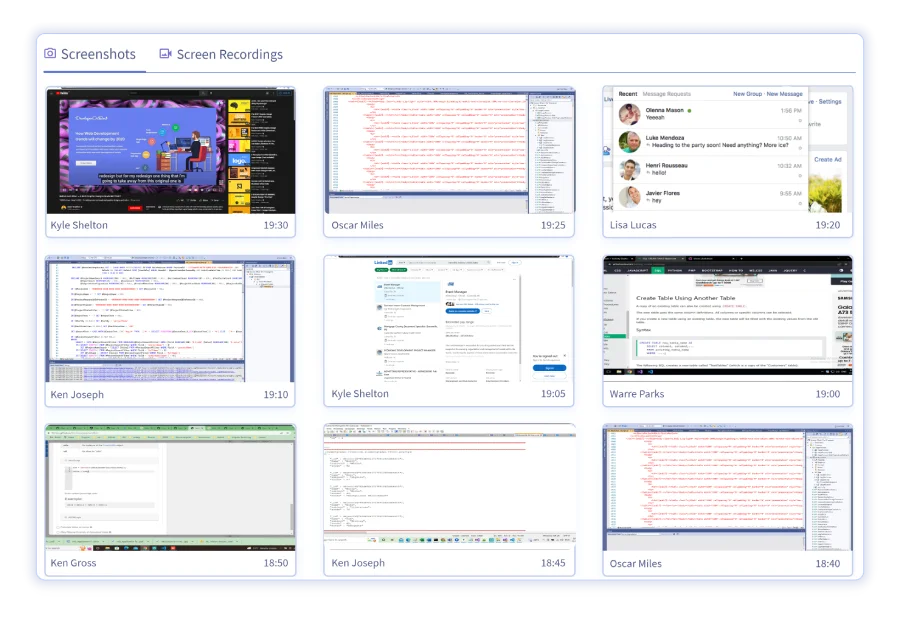
Periodic Screenshots
The Linux agent captures periodic desktop screenshots at configurable intervals (default: every 5 minutes). On X11 desktops, screenshots use the X11 screen capture API. On Wayland desktops, screenshot support depends on the compositor's implementation of the Wayland screenshot protocol; GNOME on Ubuntu 22.04 and 24.04 supports this. Screenshot frequency, storage retention, and access control (who in the organization can view screenshots) are configured per policy in the eMonitor admin panel.
What Are the Special Considerations for Monitoring Developer Teams on Linux?
Monitoring developer and engineering teams on Linux requires a different approach than monitoring call center agents or administrative staff. Developers are knowledge workers whose output is measured in code quality, feature completion, and system reliability, not in application time or activity volume. Applying BPO-style monitoring metrics to developer teams produces misleading data and damages the trust relationship that engineering culture depends on.
What Monitoring Data Is Useful for Developer Teams
The monitoring data that provides genuine value for developer team management includes: project-level time allocation (how much time is a developer spending on Project A vs Project B vs internal meetings vs unscheduled work), IDE vs browser time ratio (a useful proxy for implementation time vs research time), time-in-code-review tools (Crucible, GitHub PR interface, Gerrit), and meeting overhead as measured by video conferencing tool time. These metrics support accurate project billing for consultancies, capacity planning for engineering managers, and honest retrospective discussions about how engineering time is actually distributed.
What Monitoring Data Is Not Useful for Developer Teams
Measuring individual developer productivity through keystroke count or mouse movement intensity is a well-documented failure mode. A developer thinking through an architecture problem at their desk generates zero keystrokes but may be doing their most valuable work of the day. Monitoring systems that penalize low input activity scores incorrectly flag engineers engaged in deep work as underperforming. eMonitor's productivity scoring can be configured to classify "thinking time" (low activity in IDE with no other distracting application active) as productive rather than idle, reflecting the reality of knowledge work.
Transparency Is the Prerequisite
Developer teams have stronger opinions about monitoring than most other employee groups, and for defensible reasons: they understand how the technology works, they value autonomy, and they are in high demand in the labor market. Deploying monitoring on developer machines without clear communication about what is tracked, why, and who can see the data is a significant trust violation that typically results in turnover among the strongest performers (who have other options) and resentment among those who stay.
The deployments that work well for developer teams share a common approach: complete transparency before deployment (town hall or team meeting explaining the scope and purpose), employee-facing dashboards so developers can see their own data, explicit commitment that monitoring data will not be used for individual performance evaluation (only for aggregate time allocation and project billing), and a clear escalation path for developers who want to challenge what is being tracked. eMonitor's transparency model, where employees see the same data their manager sees, is designed for exactly this environment.
What Are the Primary Use Cases for Linux Monitoring in Commercial Environments?
Linux endpoint monitoring serves four distinct business purposes in commercial environments, each with a different justification and a different configuration of what data to collect and how to use it.
Project Time Billing (Consultancies and Agencies)
Technology consultancies that bill clients by the hour for developer time have the strongest ROI case for Linux monitoring. When developers track time manually, billable hour capture rates average 60-75% of actual work time (Association of Management Consulting Firms, 2023). Automated time tracking through the Linux agent raises capture rates to 90-95% by recording all application activity against configured project categories automatically. The difference on a 10-developer team billing at $150/hour represents $75,000 to $150,000 in recovered annual billing.
DevOps and SRE Team Capacity Planning
SRE and DevOps managers frequently struggle to understand how their team's time is actually distributed across planned work, incident response, on-call overhead, and operational maintenance. eMonitor's Linux monitoring provides the objective data: time in incident management tools (PagerDuty, Opsgenie), time in monitoring dashboards (Datadog, Grafana, Prometheus), time in deployment pipelines (Jenkins, GitHub Actions, ArgoCD), and time in communication tools. This data informs realistic sprint planning, headcount requests, and the honest conversation about how much "toil" is consuming engineering capacity.
BPO and Call Center Operations (Linux-Based Stacks)
BPO operations in India, the Philippines, Eastern Europe, and Latin America frequently run Linux-based workstations for cost management. For these environments, Linux monitoring serves the same function as Windows monitoring in Western BPO deployments: session time tracking, browser activity monitoring against the approved URL list, productivity classification of allowed vs prohibited sites, and daily activity reports for team supervisors. The monitoring depth requirements for BPO Linux environments are comparable to the Chromebook browser-based model: most work happens in browser-based CRM and telephony tools, and URL-level tracking provides sufficient operational visibility.
Data Science and Machine Learning Teams
Data science teams running Ubuntu for ML workloads represent a newer but growing Linux monitoring segment. The primary use case is project time allocation: understanding how data scientists distribute time across data preparation, model training runs, analysis and reporting, and internal meetings. JupyterLab, VS Code with Python extensions, and RStudio are the dominant application categories for this segment. Time in GPU-intensive processes (model training runs) is visible as high CPU/GPU load periods in the activity timeline.

Deploy eMonitor on Your Linux Endpoints Today
Native Linux agent for Ubuntu, Debian, and RHEL. Package manager install, Ansible automation, and unified reporting with Windows and macOS. Trusted by 1,000+ companies worldwide.
eMonitor vs Cattr for Linux Developer Teams: Which Is the Right Fit?
Cattr is an open-source, self-hosted time tracking and activity monitoring tool with native Linux support, built by a team with strong developer community credibility. It is worth understanding the genuine differences between Cattr and eMonitor for teams making this decision.
Cattr's primary advantage is full data sovereignty: because it runs on your own infrastructure, no employee activity data leaves the organization's servers. For teams with strict data residency requirements or strong cultural preferences against third-party data hosting, this is a genuine differentiator. Cattr also has no per-user subscription cost once deployed, making it cost-effective for large teams with reliable DevOps capacity to maintain the infrastructure.
eMonitor's advantages over Cattr are in breadth and operational overhead. eMonitor is a hosted SaaS service: no server infrastructure to maintain, no database backups to manage, no upgrade windows to coordinate. eMonitor's feature set beyond basic time tracking (alerts and notifications, attrition risk analytics, attendance management, DLP file monitoring, HR management integration) has no equivalent in Cattr's scope. For organizations that want monitoring to extend beyond time tracking into operational workforce intelligence, eMonitor provides that platform without requiring engineering resources to build and maintain the infrastructure.
The practical recommendation: developer teams at organizations with strong DevOps culture and strict data sovereignty requirements should evaluate Cattr seriously. Developer teams at organizations that are not prepared to maintain a self-hosted monitoring infrastructure, or that need monitoring to cover both Linux developers and Windows non-technical staff in a unified platform, should use eMonitor.
Frequently Asked Questions: Employee Monitoring on Linux
Does employee monitoring software work on Linux?
Yes, employee monitoring software works on Linux. eMonitor provides a native Linux agent compatible with Ubuntu LTS releases (20.04, 22.04, 24.04), Debian 11 and 12, and CentOS/RHEL 8 and 9. The Linux agent tracks application usage, website visits in browser, idle time, file operations, and periodic screenshots. Deployment is available via apt/rpm package managers, manual install, or enterprise automation through Ansible, Puppet, or Chef.
Which Linux distributions does eMonitor support?
eMonitor's Linux agent supports Ubuntu 20.04 LTS, 22.04 LTS, and 24.04 LTS, Debian 11 (Bullseye) and 12 (Bookworm), and CentOS/RHEL 8 and 9. Ubuntu LTS releases are the primary supported platform with the most extensive testing coverage. CentOS/RHEL support covers enterprise environments that standardize on Red Hat-based distributions. Contact eMonitor support for compatibility with other distributions.
What does the eMonitor Linux agent monitor?
The eMonitor Linux agent monitors: application usage (which applications are running and active, including terminals, IDEs like VS Code and JetBrains, browsers), website visits in Chrome and Firefox, idle and active time, file operations (creation, modification, deletion with timestamps), and periodic screenshot captures. The activity pattern on Linux is different from Windows: more terminal usage, IDE time, and browser-based tool usage, and less consumer application noise.
How do you install eMonitor on Ubuntu?
eMonitor installs on Ubuntu through the apt package manager. Add the eMonitor repository to your sources list, import the GPG signing key, run 'apt update', then 'apt install emonitor-agent'. The agent starts as a systemd service. During installation, the agent registers with your eMonitor account using a company ID token provided in your eMonitor admin panel. The full installation process takes under 5 minutes.
Can eMonitor be deployed to Linux machines using Ansible?
Yes. eMonitor's Linux agent supports enterprise deployment through Ansible, Puppet, and Chef. The Ansible deployment uses eMonitor's official role, which handles repository configuration, package installation, agent service configuration, and company token injection from an encrypted vault variable. This approach is suitable for DevOps and SRE teams managing large fleets of Linux endpoints through existing configuration management infrastructure.
Should development teams be monitored on Linux?
Monitoring development teams requires more careful framing than monitoring call center agents or data entry roles. Developers are knowledge workers whose productivity is output-based rather than activity-based, and excessive monitoring scrutiny can damage trust and creativity. The strongest case for Linux monitoring on developer teams is operational: understanding how developers allocate time across projects, identifying when a developer is stuck or blocked, and supporting accurate project billing for consultancies.
What is Cattr and how does it compare to eMonitor for Linux teams?
Cattr is an open-source, self-hosted time tracking and activity monitoring tool built specifically for developer teams. It supports Linux and provides basic app usage and screenshot tracking with full data control since it runs on your own infrastructure. eMonitor differs by offering a hosted SaaS model with richer analytics, alert capabilities, attendance management, and cross-platform unified reporting. Teams that prioritize data sovereignty and are comfortable with self-hosted infrastructure may prefer Cattr; teams that want managed infrastructure and broader features choose eMonitor.
How does Linux monitoring differ from Windows monitoring?
The monitoring data profile on Linux reflects Linux workflows: higher terminal and IDE usage, lower consumer application noise, more browser-based tool usage. Linux monitoring does not require tracking Outlook, Teams, or Office applications that dominate Windows activity patterns. The core monitoring capabilities (app usage, URL tracking, idle time, screenshots, file events) are equivalent across platforms; the application categories and typical patterns differ significantly.
Is monitoring Linux developers legal?
Monitoring Linux developer workstations is legal in most jurisdictions provided employees receive prior written notice of the monitoring policy and its scope. Standard employment contract or IT acceptable use policy acknowledgment covering computer activity monitoring satisfies this requirement in the US (ECPA) and most other jurisdictions. GDPR requires a documented lawful basis; legitimate interest under Article 6(1)(f) applies when monitoring is proportionate to the business purpose.
What should I tell Linux developers before deploying monitoring?
Before deploying monitoring on developer machines, communicate: what data is collected (app usage, browser URLs, screenshots, idle time), what is not collected (code content, terminal command content, file contents), why it is being deployed (project billing accuracy, capacity planning, or compliance), and how developers can access their own data. Developers who understand the scope and purpose typically accept monitoring for operational purposes. Developer resistance usually signals insufficient transparency about what is actually tracked.
Sources
- StatCounter Enterprise Desktop OS Market Share (2024), Linux commercial endpoint share
- Stack Overflow Developer Survey 2024, Developer primary OS distribution data
- Association of Management Consulting Firms: Time Capture Accuracy in Professional Services (2023)
- Electronic Communications Privacy Act (ECPA), 18 U.S.C. Chapter 119
- GDPR Article 6(1)(f), Lawful basis: legitimate interests
- Canonical Ubuntu LTS release schedule and support lifecycle documentation
Monitor Your Linux, Windows, and macOS Teams From One Dashboard
eMonitor's native Linux agent for Ubuntu, Debian, and RHEL gives your engineering and DevOps teams the same monitoring depth available on Windows. Trusted by 1,000+ companies worldwide.